As you may have seen from my previous post, I have now finished my PhD. I wanted to wait until all the final changes to my thesis were done before writing up more posts about doing your thesis through LaTeX.
So, part 2, tables.
Tables are really easy in WYSIWYG programs like Word. Simple tables are not really a problem in LaTeX but the moment you want to do something slightly different, things get harder.
It is possible to just write out the markup for your table from scratch, and that's a good exercise to understand how things work that I recommend to do. However, you can also "cheat" or use a shortcut.
Excel2latex is a plugin for LaTeX that allows you to export the table you design there as LaTeX code directly ready to paste into your environment. You can do things easily that are otherwise fiddly to code in LaTeX such as colouring cells, complex arrangements of merged and split cells, and where to put borders. I used this for every single table in my thesis, editing and fixing small bugs as appropriate. It probably saved hours of time versus writing it myself.
Let's go through some specific examples from my thesis to demonstrate...
The Basics

\usepackage{threeparttable, booktabs} % booktabs for \bottomrule\toprule\midrule
\usepackage{longtable} %for tables that go over more than one page.
\usepackage{array, multirow}
% Table generated by Excel2LaTeX from sheet 'fab'
\begin{table}[ht]
	\caption{French-American-British Classification of AML\cite{Krause2007, Behm2003}} \label{tab:fab}
	\footnotesize
	\begin{tabular}{lp{0.6\linewidth}l}
	\textbf{FAB\#} & \textbf{AML name} & \textbf{Cell origin} \\
	\midrule
	M0    & Acute myeloblastic leukaemia without differentiation & Myeloblast \\
	M1    & Acute myeloblastic leukaemia with minimal differentiation but with the expression of myeloperoxidase & Myeloblast \\
	M2    & Acute myeloblastic leukaemia with differentiation & Myeloblast \\
	M3    & Acute promyelocytic leukaemia (APL) & Promyelocyte \\
	M4    & Acute myelomonocytic leukaemia (AMML) & Monoblast \\
	M4eos  & Acute myelomonocytic leukaemia bone marrow eosinophilia & Monoblast \\
	M5    & Acute monocytic leukaemia (AMoL) & Monoblast \\
	M6    & Acute erythroid leukaemia (AEL) & Proerythroblast \\
	M7    & Acute megakaryocytic leukaemia (AMKL) & Megakaryoblast \\
	\end{tabular}
\end{table}
Table 1.1 is a simple table with just 3 columns - a good one to start with. The first block of code are the packages I've used for all the tables. Not all are needed for all tables but since they are loaded, it's easier to include them here.
The second block of code first opens the table environment and determines how it is located in document (here, top[of page]). The caption appears at the top of tables by default and at the bottom of figures. Obviously you and probably should include references here. I also labelled all my figures/tables etc for ease of cross referencing. It's easier to do this at the time with something descriptive rather than numbering as your order may change with edits.
I found the default text size in tables too large so I changed everything to \footnotesize but this is a personal choice. Then the actual table data begins with \begin{tabular}. The arguments to this look confusing at first but are easy. If you had {ccc} you'd have 3 columns each with centred text, {lll} would have left aligned text, and {rrr} right aligned. My middle column here is marked to be a particular fraction of the total line width p{0.6\linewidth} because I needed to force the width to be longer for clarity.
The next line is the header row and I've emboldened each of the headers. Note how elements in a row are delimited with "&" and the end of the line is with "\\". Also note the \midrule to add a line. Then the tabular and table environments need to be closed. That's it! Your first simple LaTeX table. A bit more complicated already than Excel but using the Excel2Latex plugin linked above will help.
Images in tables
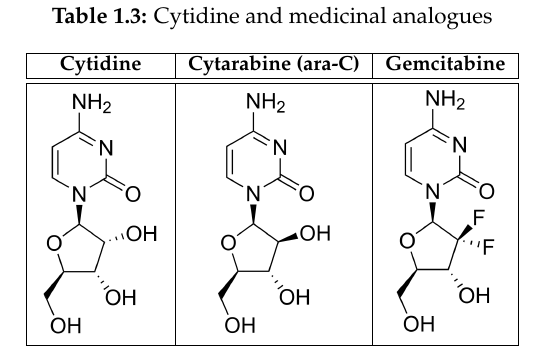
% Table generated by Excel2LaTeX from sheet 'C nucleosides 1'
\begin{table}[htbp]
	\footnotesize
	\centering
	\caption{Cytidine and medicinal analogues}
	\begin{tabular}{|c|c|c|}
		\hline
		\multicolumn{1}{|c|}{\textbf{Cytidine}} & \multicolumn{1}{c|}{\textbf{Cytarabine (ara-C)}} & \multicolumn{1}{c|}{\textbf{Gemcitabine}}\\
		\hline
		\hline
		\includegraphics[width=0.15\linewidth]{Figures/chemicals/cytidine} & \includegraphics[width=0.15\linewidth]{Figures/chemicals/cytarabine} & \includegraphics[width=0.133\linewidth]{Figures/chemicals/gemcitabine} \\
		\hline
	\end{tabular}%
	\label{tab:c-derivatives}%
\end{table}%
Of course it is also possible to include images in a LaTeX table. For this, I found it easier to have the figures already prepared in a folder. Using Excel2latex, you can include the necessary code to include a figure in a column \includegraphics[width=0.30\linewidth]{Figures/chemicals/cytidine} for example.
I'm not actually sure that the multicolumn code is required here - it's been a while since I wrote this so not sure why it's there at all! But it is useful for the next thing I want to explain...
Merging headers
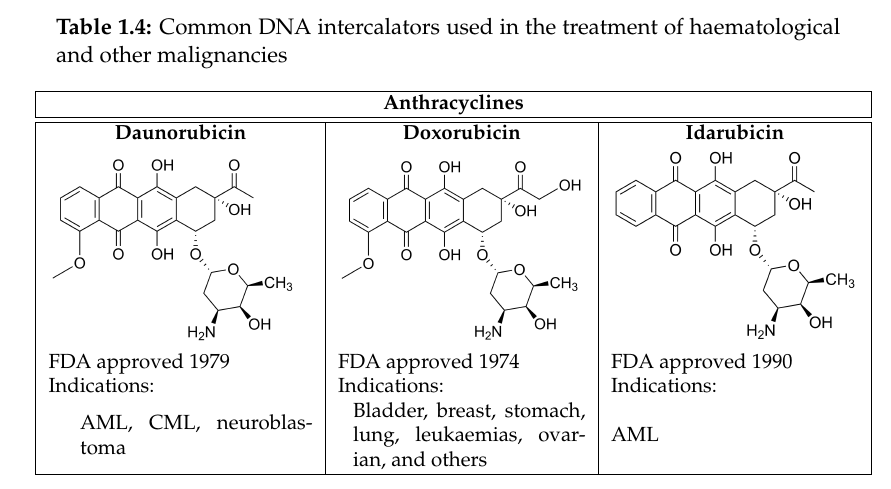
\begin{table}[htbp]
	\centering
	\caption{Common DNA intercalators used in the treatment of haematological and other malignancies}
	\footnotesize
	\begin{tabular}{|l|l|l|}
		\hline
		\multicolumn{3}{|c|}{\textbf{Anthracyclines}} \\
		\hline
		\hline
		\multicolumn{1}{|c|}{\textbf{Daunorubicin}} & \multicolumn{1}{c|}{\textbf{Doxorubicin}} & \multicolumn{1}{c|}{\textbf{Idarubicin}} \\
		\includegraphics[width=0.30\linewidth]{Figures/chemicals/daunorubicin} & \includegraphics[width=0.30\linewidth]{Figures/chemicals/doxorubicin} & \includegraphics[width=0.30\linewidth]{Figures/chemicals/idarubicin} \\
		FDA approved 1979 & FDA approved 1974 & FDA approved 1990 \\
		Indications: & Indications: & Indications: \\
		\multicolumn{1}{|m{4cm}|}{AML, CML, neuroblastoma} & \multicolumn{1}{m{4cm}|}{Bladder, breast, stomach, lung, leukaemias, ovarian, and others} & AML \\
		\hline
Table 1.4 is only part of a more complex larger table but this is sufficient to outline the important next step: merged cells. \multicolumn{3}{|c|}{\textbf{Anthracyclines}} \\ means that we create a column that spans 3 columns, it is centred with lines on each side, and has the bold text Anthracyclines. This can be applied anywhere. LaTeX will count the total number of columns when compiling and throw an error if it is greater than it should be as defined in your \begin{tabular}{|l|l|l|}.
Mixed figures and tables
It is also possible to mix figures and tables together.
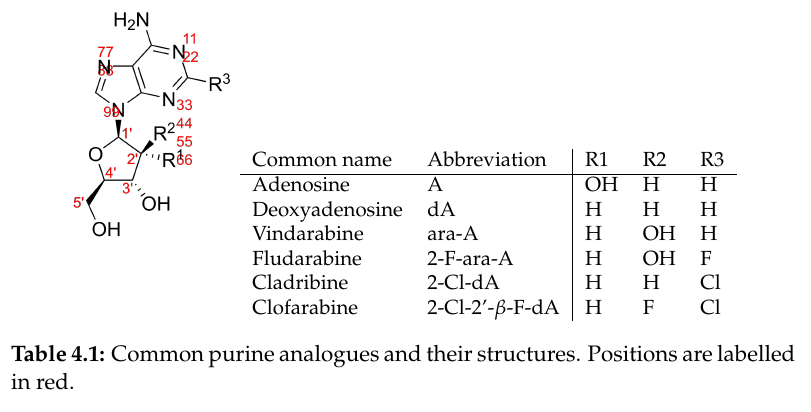
% Table generated by Excel2LaTeX from sheet 'Chemical R'
\begin{table}[htbp]
	\centering
	\footnotesize
	\includegraphics[width=0.2\linewidth]{../Figures/chemicals/purinesR3}
	\begin{tabular}{ll|lll}
		Common name & Abbreviation & R1    & R2    & R3 \\
		\hline
		Adenosine & A     & OH    & H     & H \\
		Deoxyadenosine & dA    & H     & H     & H \\
		Vindarabine & ara-A & H     & OH    & H \\
		Fludarabine & 2-F-ara-A & H     & OH    & F \\
		Cladribine & 2-Cl-dA & H     & H     & Cl \\
		Clofarabine & 2-Cl-2'-$\beta$-F-dA & H     & F     & Cl \\
	\end{tabular}%
	\caption{Common purine analogues and their structures. Positions are labelled in red.}
	\label{tab:purinedrugs}%
\end{table}%
I only had to do this a couple times during my thesis and it's probably not necessary most of the time. My technique was opening a table environment \begin{table}[htbp] then inserting the image, before opening the tabular. I chose to have the caption at the end for this, but that's a personal choice.
Tables over multiple pages
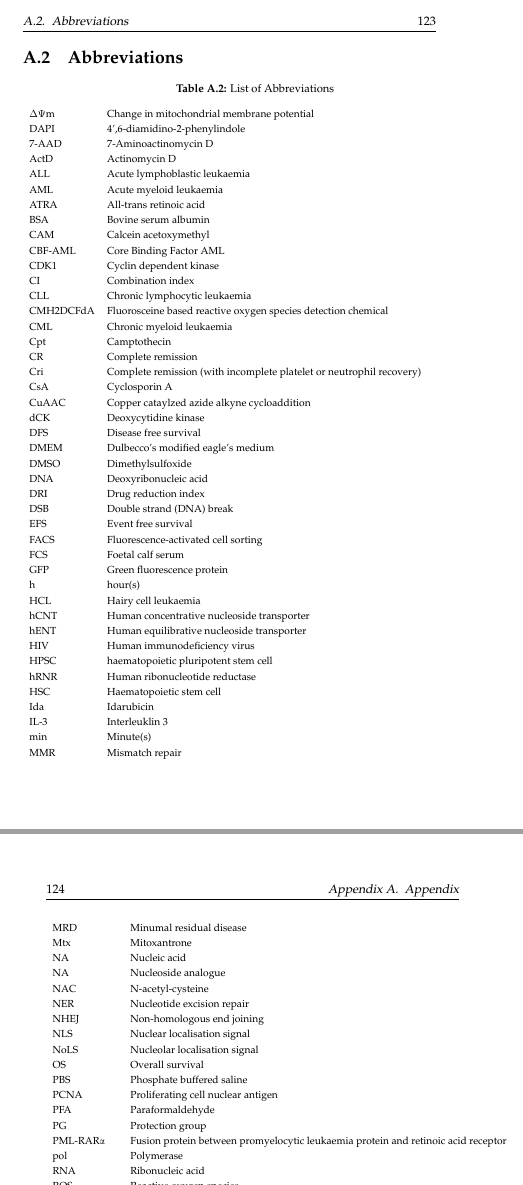
\begin{longtable}{ll}
\caption{List of Abbreviations} \\
\textDelta \textPsi m   & Change in mitochondrial membrane potential \\
DAPI  & 4',6-diamidino-2-phenylindole \\
7-AAD & 7-Aminoactinomycin D \\
ActD  & Actinomycin D \\
...
...
...
TOPOII & Topoisomerase II \\
yPAP  & Yeast polyadenylation polymerase \\

	\end{longtable}%
	\label{tab:abb}%
For my appendix, the content was over two pages. I didn't feel it was appropriate for two columns (technically four), so used the longtables package that I called in main.tex above. It's not a difficult package to use and is quite normal. I used the excel2latex plugin to cheat in making the list easier. I also kept a running list of abbreviations I used during my thesis in that same excel sheet to make things even easier.
Conclusions
LaTeX tables can be quite intimidating for a newbie. I had read and watched a few tutorials explaining them and it scared me off for a while. After spending a little time, they were actually one of the easier aspects of writing the thesis, and I hope that some examples I ran through here are also helpful to you.